Raising Frankenstein…Bringing a BSX Insight Back to Life

20 01 2020

So…after being away from racing while employed at DHS (a rather “not what I thought is was going to be” type of experience,) I decided to look for employ where I could (actually) use my technical skills from my post-grad degree. After all, why endure all that effort, expense, and time only to not use it? This decision led me to new job-field entry discussions with WSDOT, which led to a certification in an ESRI GIS course, certification in the Python 3 programming language, and a professional certification in IBM data science. Moving right along, I’m happily absorbing specialty courses in machine learning (really fun stuff by the way.)

By the nature of my blog, you know that I like to use tools at hand to examine, evaluate, and improve the processes I’m interested in, namely, improving my physiological systems in order to accomplish my racing goals. One of the tools I’ve used in the past was the BSX Insight device. In early 2018, BSX Technologies decided to discontinue support for the monitor effectively turning it into a brick; much to my disappointment. (And that’s saying it nicely.) That was about $300 USD out of my wallet so the news was not received lightly. My 2nd generation monitor started gathering dust.

Then I found this: Start BSX without the app or internet using an Android device. Basically, the author used the nRF Connect App in an Android device to connect and start the BSX Insight monitor. What? I had already used this App to diagnose other BLE hardware but did not know the specific write values and specific UUIDs to start my monitor.

I had to try this windfall. Incredulously, while my tablet was starting, I dug out my Garmin Edge 810 head unit, powered-up, and selected the BSX sensor feed profile I set up so long ago. I scrambled back to the tablet. Opened the nRF Connect App, enabled the (3) notification characteristics, and then wrote the hexadecimal value “0402” to the UUID indicated in the blog post above annnnddd…

DATA STREAM!

I couldn’t believe it. There, on my Garmin display, were my SmO2 and tHb values happily reporting what my forearm muscle was doing energy-wise.

Figure 1. BSX Insight Enabled and Reporting to a Garmin Edge 810

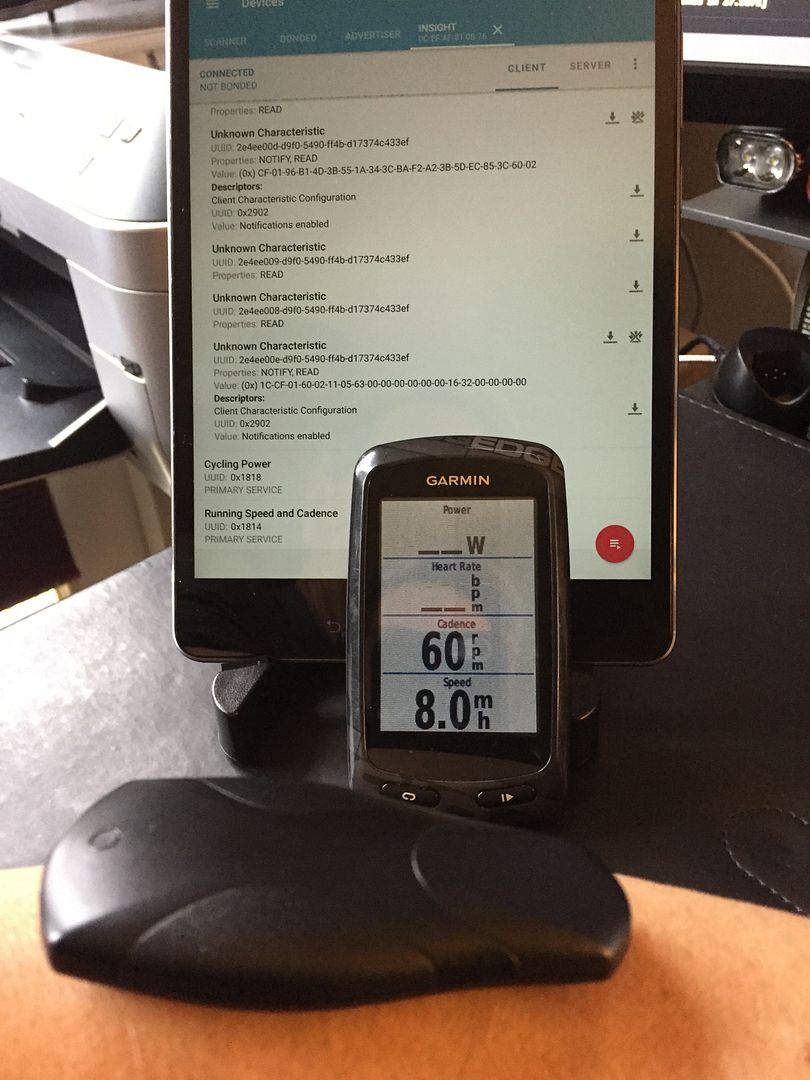
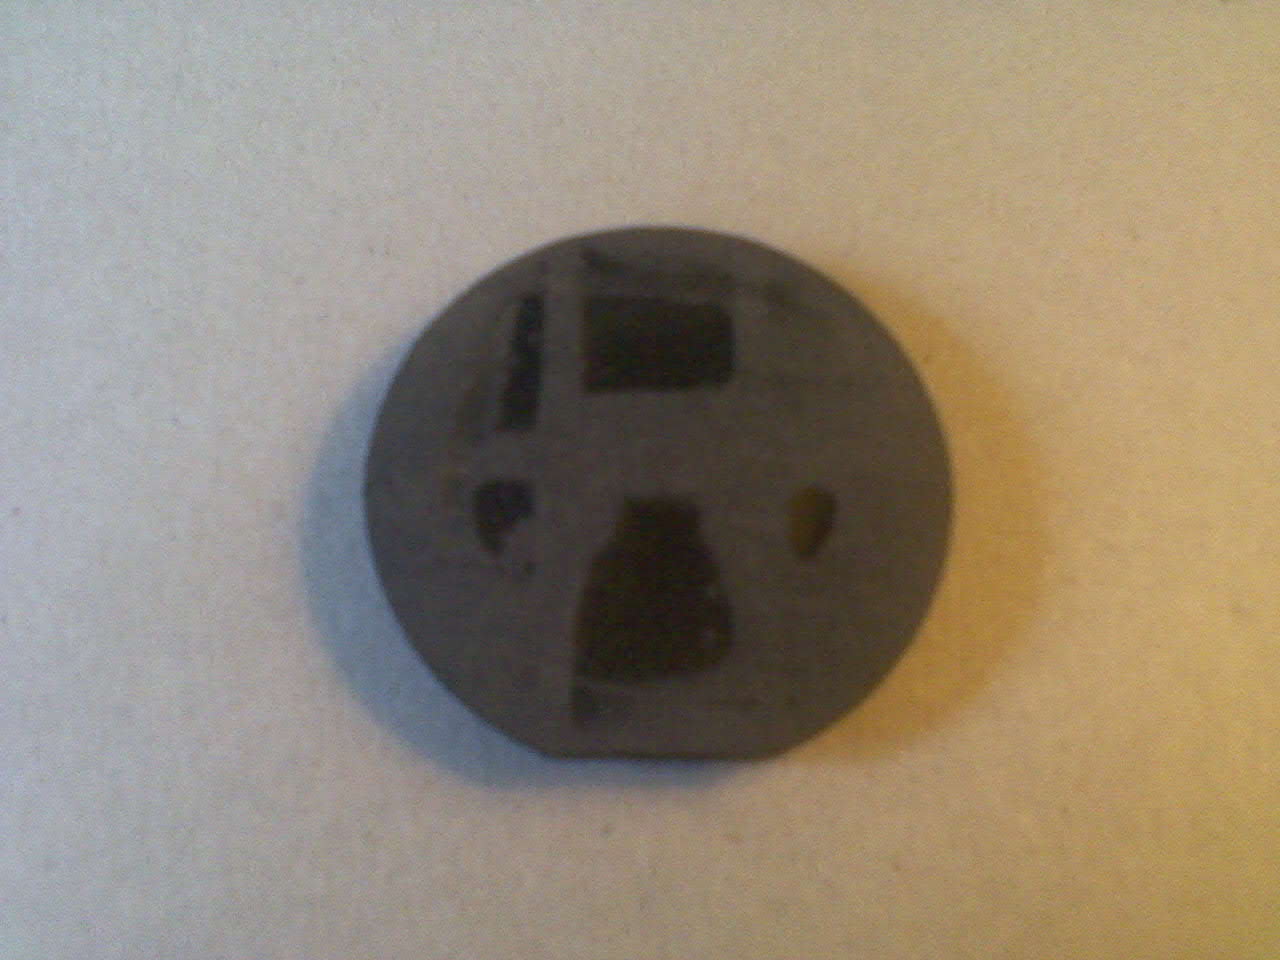
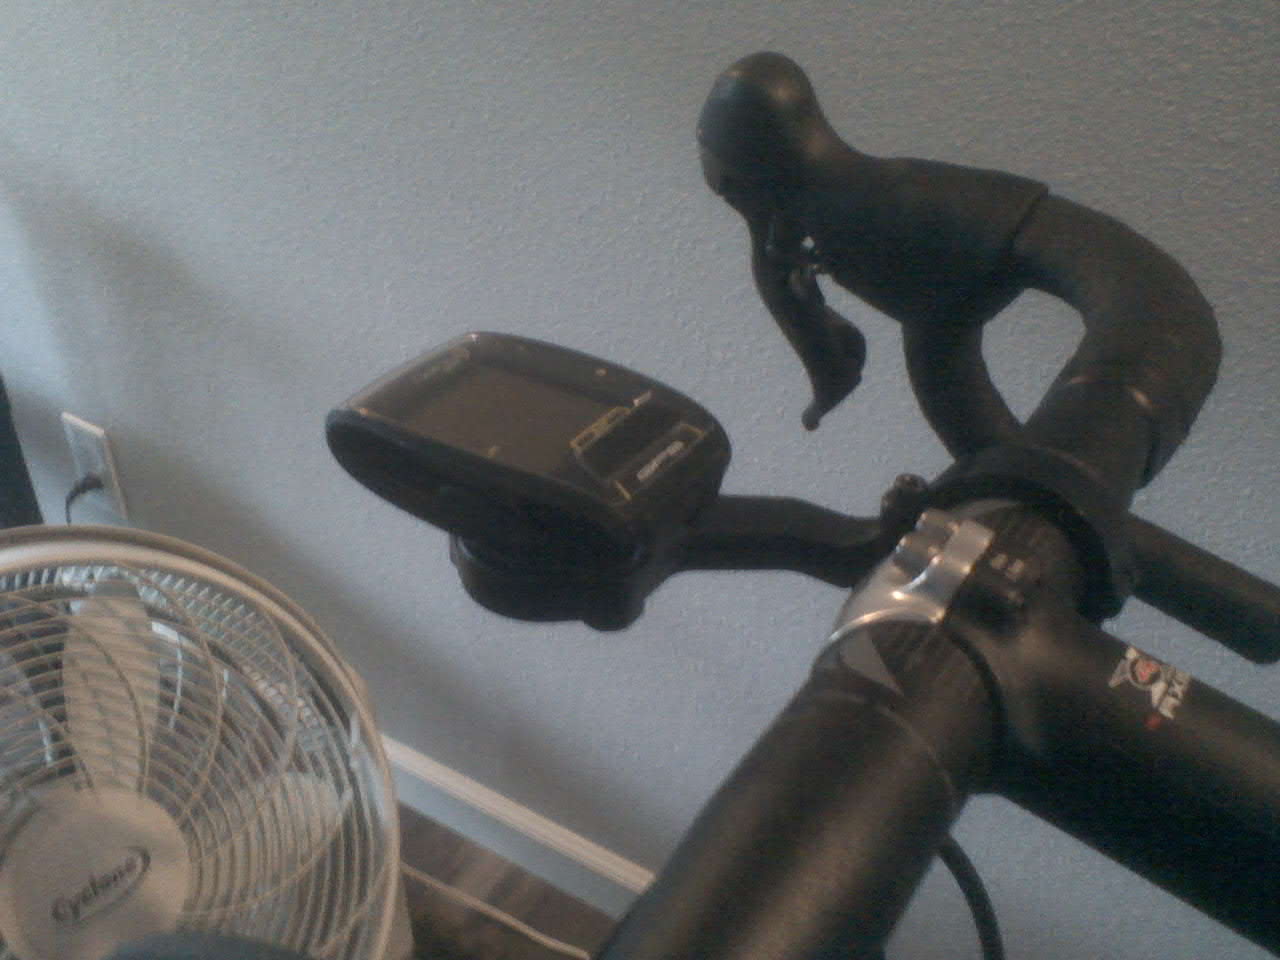
In Figure 1, we see the Insight monitor sitting on my forearm. Behind, my tablet shows the nRF Connect App. Between, my 810 displays the SmO2 as “rpm”, and tHb “mph” values. Note that years ago, this sensor profile using the “rpm” and “mph” labels was the only one I could utilize with the 810 model. Today, there are various other cycling devices which display the metrics correctly.

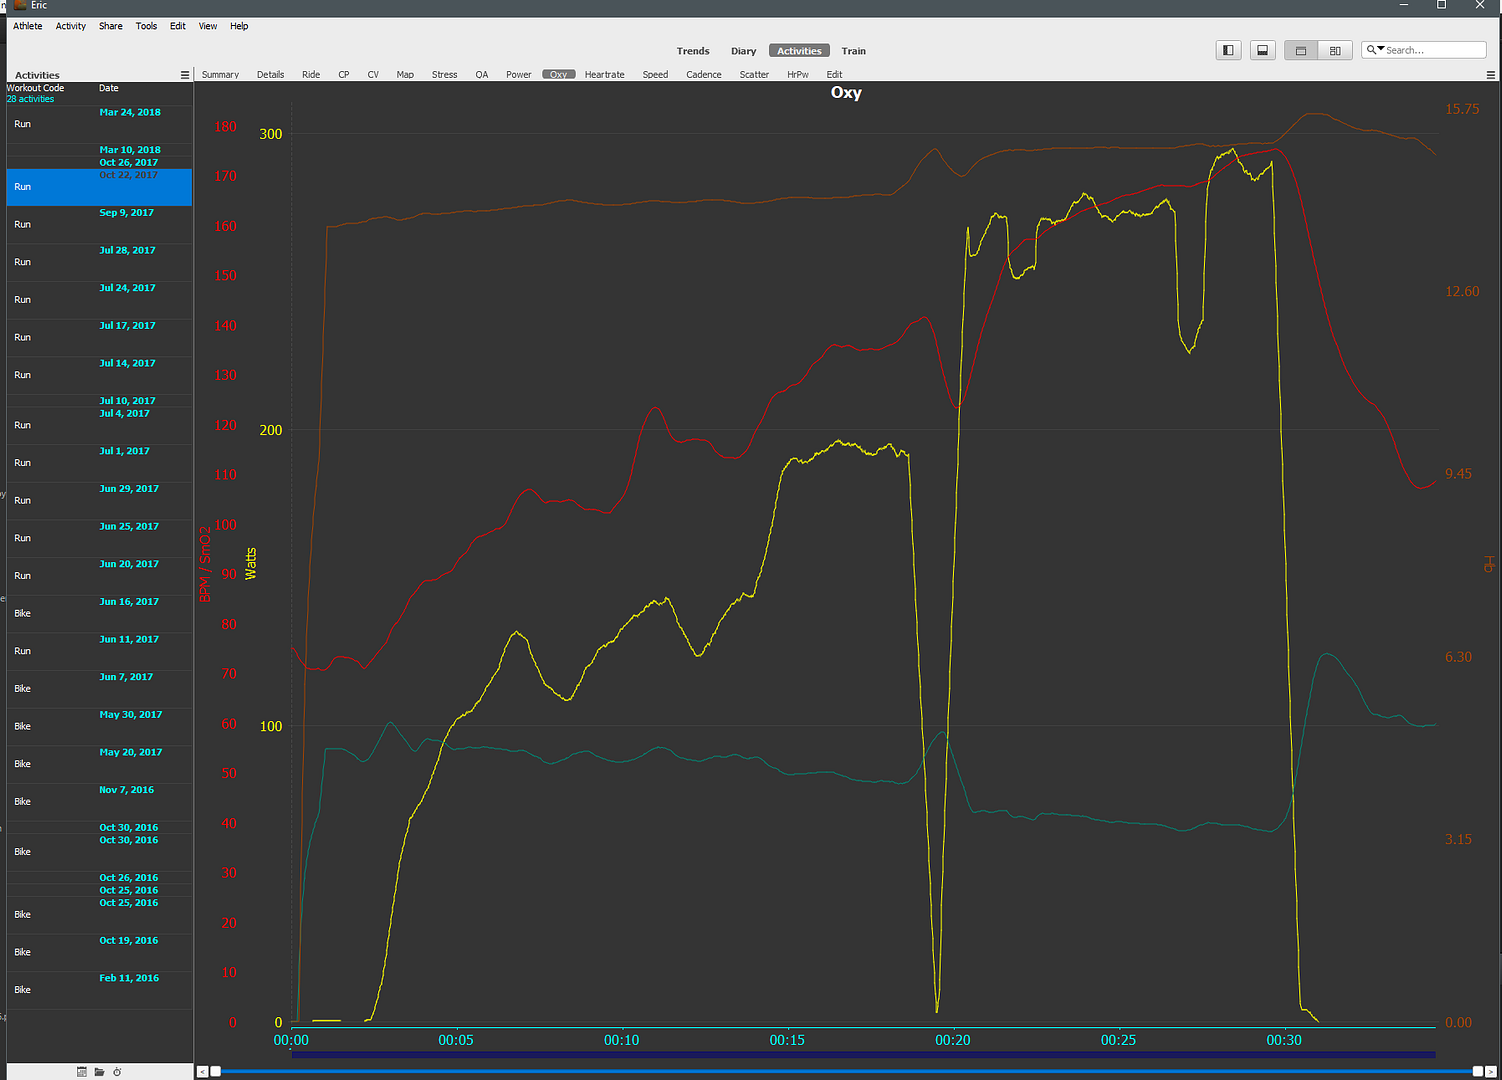
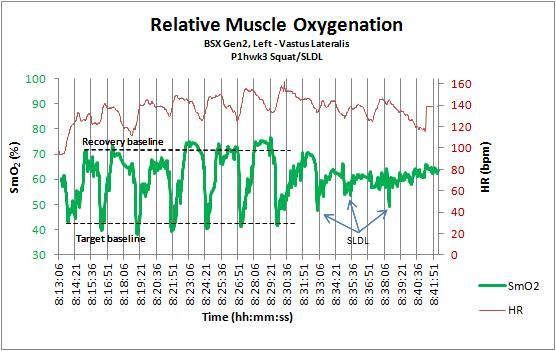
Back then, I used the very flexible and open source Golden Cheetah software (GC) to assemble all my data streams onto one display:

Figure 2. Golden Cheetah “Oxy” tab showing W (yellow), HR (red), SmO2 (blue), and tHb (brown) Data Streams

I’m sure I’ll figure out if I want to continue using GC or if another platform would be more suitable, such as Rouvy. I’m not certain that I’ll be able to configure the BSX data streams because the Rouvy App interprets the device as an rpm/speed sensor:

Figure 3. Rouvy’s Post-Ride Data Display Example

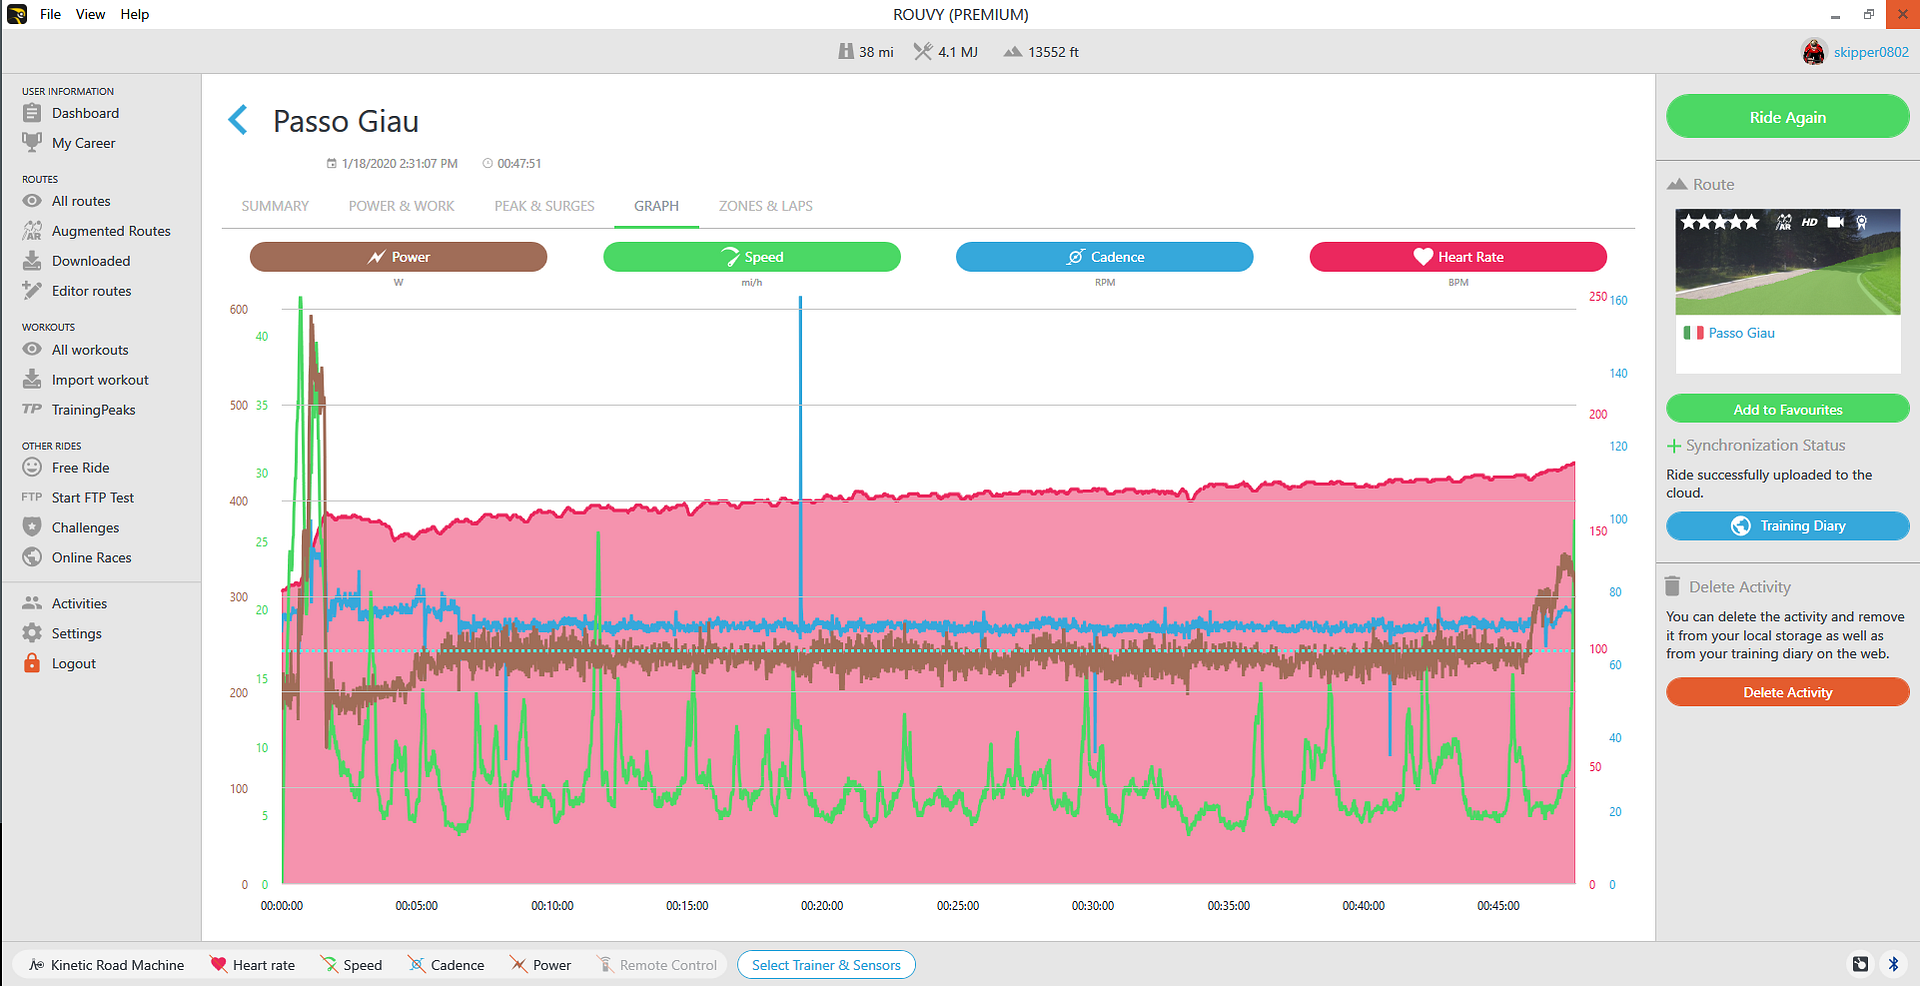
Figure 3 shows how Rouvy displays your post-ride measures. This example show my usual sensor input setup for a trainer session. There is a “workout” mode that I have used for HIT intervals or specific training targets, but as of this writing I’ve not verified how I might integrate the BSX streams.

Bring on the Python skillz…

Figure 4. Using Python and tkinter to Build a New GUI for the BSX Insight

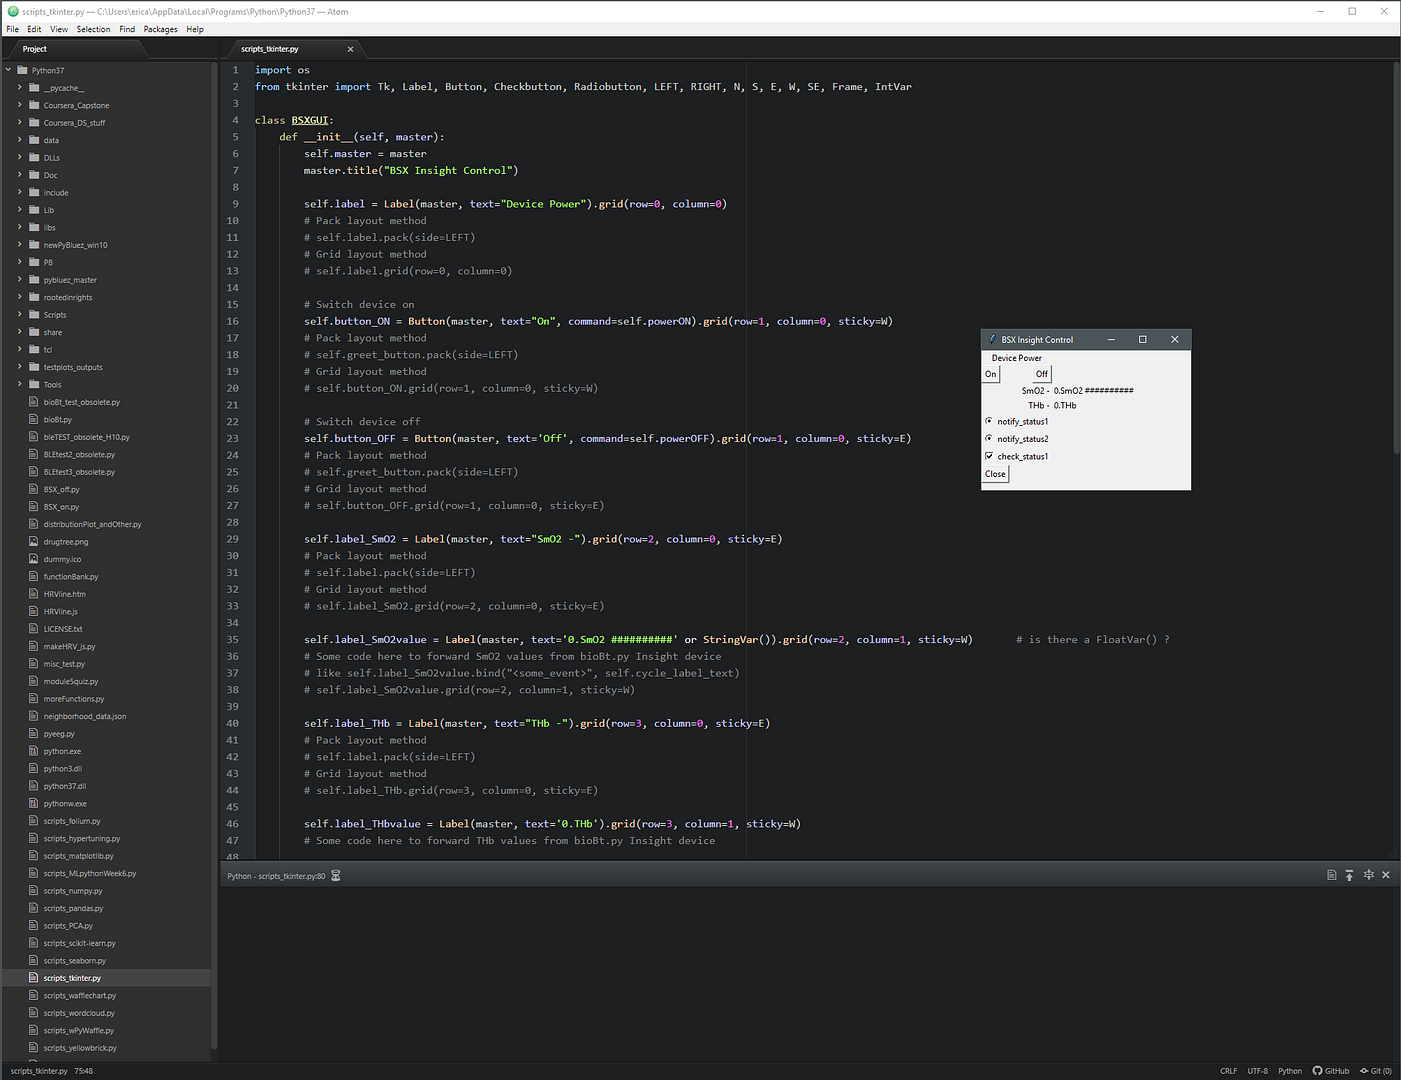
At any rate, I’ve set about building my own BSX Insight GUI/interface using Python. The first Python-Windows compatible package I’ve found is tkinter. Thus far my experience using this library to build the GUI has been lukewarm, but I just want something functional for now…I can always make it pretty later. I’m relieved that my Insight monitor will not join the group of today’s electronic detritus. It can still provide useful information.

I’ve the idea to assemble ALL of my data into one structure so that I might throw my data science skills at it in order to help answer the many questions I have about achieving physiological training goals. And that’s definitely a post in the future. I hope all of you will find what you’re looking for in this new year. Thanks for reading.


Not So Quick Fix for Broken Joule GPS Mounting Tabs

17 03 2016

So I finally rendered my Cycleops Joule GPS un-mountable. I could always just toss it in my jersey pocket before rolling-off, but then I’d have to fish it back out if I needed to look at the display. And that’s kind of a PITA. I suppose the tab yielded to my abuse and decided to break. On the other hand, maybe it’s about time. I mean, the thing’s almost six years old. Then again, I’ve no stats on the expected product life span of this gadget. Additionally, I’m not the only one to have broken tabs happen. Other users experienced the same thing. It’s perfectly functional except for not being able to mount it on my bars. What to do?

Yeah, well, fix it. That’s what to do. The first thing I did was to call the folks at Powertap, and ask them for a replacement back cover. No such luck. Furthermore, they offered $150 to replace a mostly functional unit, that its, the back cover is not replaceable.

Irritated, I scoured the internet and found an article that showed a new tab “plate” attached to repair a Garmin unit. This gave me an idea: I already have a Garmin 810; is there a replacement tab part for their device? Kind of. I found plenty of Garmin back covers on Ebay. You pay about $25 USD for a Garmin 500 (or 800/810) back cover and lithium battery, plus you get to wait while this thing ships from China. Mnnnah— nope. More irritation. I kept looking, and good thing to because I found this little jewel:

quickview
Figure 1. The Solution (Cheap, like $7 USD)

This is SRAM’s Quickview Adapter Mount. I thought, “Cool. I can use this to make a new mount.” How would I attach it? Yeah, I’m not putting screws into the body—not a good idea because I don’t know what’s behind the back case. (This would be a different story had I been able to get the back cover removed to inspect.) Anyway, “Maybe I can glue it.” So the question is now: What materials are involved here? A call back to Powertap reveals that the back casing is made of polycarbonate, which reminded me that I haven’t had much luck with before on the glue situation. This little SRAM adapter’s made from nylon/glass composite. Again, more materials complexity.

More searching around on the internet shows that one of the top company’s for different adhesive bonding scenarios is JB Weld. Note that this is not a shill for the company, but I have used their usual two-part epoxy for a bunch of stuff in the past. Their “plastic bonder” product, as confirmed by the tech. rep. that I talked to, seemed to be the perfect adhesive for this project. This project was starting to look better.

Quick steps:

EXIF_JPEG_T422
Figure 2. Grind the lower half of the adapter flush
EXIF_JPEG_T422
Figure 3. The flip side
EXIF_JPEG_T422
Figure 4. The broken tab and the sanded surface ready for adhesive. The new mounting tab plate adjacent.

At this point, make sure that you assemble the quarter-turn tab plate in the correct orientation. In this case, the mounting tabs place is at the 3 and 9 o’clock locations (not shown.)

EXIF_JPEG_T422
Figure 5. The repaired Joule GPS mounted in out-front style
EXIF_JPEG_T422
Figure 6. Not much stack height increase

That’s pretty much it. I’ll add a longevity comment later-on once I’ve completed a few races and/or significant rides using this setup. I’ll be watching how vibration affects this rig.

Thanks for reading!


A Quiet Start to the 2016 Season

17 03 2016

It’s pretty quiet. At least from my perspective; the months and weeks of off-season training gave way to the first event: The Ridge Circuit Race and Time Trial #2. I finished well, not having bonked, or experienced a mechanical or flat, or having bumped elbows or shoulders with another in the bunch. Maybe this was karma from having completed a preemptive commuter crash during an evening return from the super market (read: got it out of my system.) Or maybe it was ’cause everyone in the pack was super cool and not real nervous. (Most of us were Cat 3 masters.)

This was a first-time event site for me and I found the experience a positive one overall. The venue was well-organized, had plenty of parking (paved or gravel,) and the Motorsports park environment a nice change from courses run on public roads. The weather was typical northwest overcast with occasional rain, and the ~9 mph wind was out of the WSW. The course was already wet. I hoped more rain would stay away for a while.

Bird's eye view of the race track
The Ridge – Bird’s eye view

The pop-up awning went up and this time I staked it down…if it rains, no problem, I’m ready. At earlier events, not tying down meant that the wind would blow it over and crumple it like tissue— no worries right? I’ve repaired the thing twice so far. Got the gear bags, trainer, and stuff laid-out. Race prep as usual.

20160227_103747
Figure 1. On the straight-away into the Finish, looking toward the downhill “S” turn
Figure 2. The Finish seems farther than it is…

I learned a couple of things this day…one, fix that front-end high-zoot skewer (the one that keeps loosening.) two, tweak the TT position to bring the elbows in more, three, even though the pop up awning might be braced-down, the wind can STILL blow it down. As was the case when I returned to my car after the circuit race.

20160227_141645
Figure 3. Circuit race. I’m (hidden) drafting the guy with the yellow frame

The circuit race was without mishap, no bumping, bar-ends getting tangled or any such nonsense, just a clean race. A good start to the season. At any rate, round and round we went. Into the wind and out of the wind. The “selection” for the last lap was decided at the top of the descent before the corkscrew, and I made sure that I was in the right place at the right time. Kyle (the rider in red, Figure 3,) was first into the corkscrew. I was second. I feathered my brake too much and watched him get on-the-gas out of the last turn. Even on the top of my gears and out of the saddle; I wasn’t able to close the gap.

20160227_142341
Figure 4. Out of gears and out of time…approaching the Finish.

A fun race and venue, and an easy drive. I’ll look forward to next year’s opening. Thanks for reading and good luck with your race season!

Podium3rd2
Figure 5. 3rd place for the Circuit race this day.


Here, There, and Back Again. Incorporating Muscle Oxygenation (SmO2) into Training

13 11 2015

What? It’s been almost a year since my last post. Incredible how time flies by. On the other hand, when you crash hard in a race sometimes it takes awhile to come back.

The outlier crash during the Wenatchee Criterium left me with many facial fractures and wondering if I was ever going to be the same again. Short story version our group was overtaking a lapped racer, some rolled into turn #1 on the inside line, me and some others rolled-in from the outside line. Yeah, I thought there’s plenty of room for us to pass, and we’ll be able to carry our speed through the turn. (This was coasting down from 32 mph – I looked at the Powertap file some days later.) Sure, plenty of room, until…lapped racer guy decides to change his line in the middle of the turn. “No! no! no!” is what I heard my self yelling but it was too late. My front wheel was already overlapped and he was moving out taking us toward the curb. I knew I was going down. The surprise was the steel “No Parking” sign post that materialized right in front of my face. Like it beamed down from the Starship Enterprise. I heard the metallic ping, felt the bouncing-crack of bone all in slow motion. And then there was blackness. That flipping sucked. Worse yet was the two weeks that followed while I had to drink all my meals as my face bones knitted back together. Talk about weight loss. Anyway, that’s over and done with, as is the anger what accompanied it. Next time I’ll move to an inside line early. The 2015 competitive season was a write-off loss after that point.

Anyway, my last post discussed HRV as a means of quantifying recovery. If I recall correctly I didn’t find it fully reflective, that is to say, most of the time I think the method and data were truly representative of my state, but there were other times when I think the estimate was a bit off the mark.

So, on to other things. You may have heard of blood oxygen saturation as a personal, dynamic, physiological indicator of how your particular muscle group(s) is meeting the demand for cycling power? Well, there’s two devices now retail-available by which you can harness this next evolution metric. The first is the MOXY muscle oxygen monitor. A small, portable, go-with-you device that measures the saturation metric (SmO2) at the muscle group of your choice. It will give the SmO2 and blood volume (tHb) metrics so you can get a detailed understanding of what’s happening in your system. The MOXY broadcasts its data via the ANT+ protocol. The other device is the BSX Insight, Generation 2 sensor. Likewise, this instrument measures relative SmO2 and (drum roll) uses an optional protocol to report your lactate threshold in watts and heart rate units. Additionally, this units provides your training zones (based on Dr. Coggan’s percentile structure I believe.) The BSX Insight will accept ANT+ data streams from HR straps and power-measuring devices, and is controlled via Bluetooth from an iPad or Android device. At the moment, The BSX does not broadcast any other devices.

So, for my first move to integrate muscle oxygenation into my training plan, I wrote this short report at the MOXY forum: “First Use of SmO2 during Hypertrophy Training”

“Greetings all,
I hope this is the correct place to post my information and experience using SmO2 to monitor the current lifting phase.

Context:
Back squats: Phase 3 of 4 hypertrophy period. Lifting four days/week with a full break on Wednesday. Monday and Thursday are heavy lift days (65, 70, and 75% of one-repetition-maximum -1RM). Tuesday and Friday are light lift days (60, 65, and 70% of 1RM respectively.) Each percentile level consists of two sets of 10 to 12 repetitions each separated by 1.5 to 2 minutes of rest.
Stiff-legged dead lifts: three sets of eight repetitions each separated by 1.5 to 2 minutes rest
51-year-old, male, road-racing since 2009, firm user of periodization plans and quantified, goal-oriented training

Routine: warm-up with 2 minutes of running stairs and no-load squats at the top/bottom of stairwell.

Here’s the results:

P1hwk3 squat sldl.jpg


Observations:

  1. Starting SmO2 level (~50-70%) appears as expected at the left vastus lateralis location based on other workouts
  2. The recovery baseline was met in all squat lifts except after the second (~8:19:21)
  3. The target, or depletion baseline was met in all squat lift attempts
  4. SmO2 re-stock seems to replenish sufficiently, although the trend slope is steeper/quicker during intervals on the bike trainer comparatively
  5. Stiff-legged dead lifts (SLDL) follow the squats after weight change on the bar
  6. The current weight level of the SLDLs do not seem to produce the same SmO2 depletion rate as the squats before
  7. The SmO2 SLDL re-stock rate seems rather slow compared to the squats rate
  8. Weight bar/rack clean-up occurs after the last SLDL (~8:39)

Discussion:
Monitoring format was based on the guidance from “Moxy Strength Training eBook.” Full recovery was used between lifts as a starting point. Unfortunately, my device does not expose the tHb metric, although the text mentions using this metric as a performance indicator.

Warm-up and bar setup ends at about 8:16. One difficulty was the inability to observe the real-time measure of SmO2 during lifting by use of the Tablet software application. The squat rack is outside and exposed to the weather, which in the current Seattle, Washington weather, would likely render the device unusable. Between-lift breaks are controlled with a stopwatch. I think in order to use the other recovery protocols, I would need to observe the SmO2 measures in real-time, or use appropriate stopwatch durations based on re-stock trends for like workouts.

It’s likely that I didn’t rest long enough after squat #2 in changing weights to the next level (65% 1RM,) hence the insufficient recovery level.

Questions:

  1. I’m not certain that the depletion target (~43%) meets requirements? Is this target sufficient to cause hypertrophy adaptation? Thoughts?
  2. I think that the SLDLs required their own recovery/target baselines since they are a different lift pattern. Thoughts?

I think I’m generally on the right track in order to achieve the plan intent and outcomes. My plan is similar to last year’s; and contains corrections for lessons-learned. Your comments and thoughts are welcome! Thanks for reading.”

There will be more posts with SmO2 content to follow. Specifically, reports concerning the determination of training zones based on individual physiological markers like SmO2 and tHb, and improving the quality of focused training like intervals. Stay tuned and thanks for reading!


End of Phase II—Two Steps Forward, One Step Back? Using HRV in a Training Plan

31 12 2014

I’ve found curious results when considering heart-rate variability (HRV) readings in the training plan. For the most part, the two analysis domains followed the proper trend, that is to say when the LF/HF ratio was high, the dominance level of HF power was low as was the index for the natural log of rMSSD x 20. That being said, I look back over the respective phases and think about where I am versus where I thought I would be. Maybe there’s more “art” to this than “science.”

Back in September, I wrote about a phased training plan that I would use to organize my off-season training. Soon after, I learned a bit more about HRV and it’s value as a factor for day-to-day training decisions. There are two types of analysis that I pay attention to: time-domain and frequency-domain. Fortunately, the Kubios HRV software puts the results side-by-side for easy comparison.

There were roughly 21 medical and sports journal articles that I studied when I decided to check what I call the “big picture.” That is to say, I would watch the Mean R-R, SDNN, and rMSSD variables from the time-domain analysis, the LF/HF ratio (Fast Fourier Transform,) and LF/HF ratio and HF (AR) variables from the frequency-domain analysis. The reason I did this was because most of the journal articles held conclusions for particular domains (and metrics.) Since I was extracting the report variables all at the same time from the Kubios software, there wasn’t any extra work involved to create the tracking graphs. (I feel that I should at least mention that the “non-linear” group of variables were available, but that I didn’t see enough recommendation or acceptance within the art to call for tracking them.)

Day-to-day decision rationale: I mostly consider the following graph (Figure 1) for training vs. recovery decisions. If the index is low (near or below the lower standard limit,) I opt for a day of rest. If the index is between 47 and 52, I’ll workout, but maybe with a lesser duration. If the index is higher than 52, I’ll definitely put in a hard or extended workout. I do look at the other tracking graphs, and if they point the other way, I’d re-consider…again viewing the big picture. Thus, a higher index indicates increased capacity to engage a tough workout and benefit from it.

Line graph of the natural log of rMSSD times 20

Figure 1. rMSSD variable from the Time-domain analysis

Some remarks about the various phases:

  • Resistance Phase/hypertrophy (P1h)—I had the impression that my legs mass-gain would be more…granted I added 16 pounds of body weight and a 5% increase in body fat compared to this time last year. Then, the BF calipers indicated less than 10% so the current level of 15% objectively puts me at the “fat body” self-ranking. On the other hand, my wife says my thighs definitely got big and my butt got rounder (she says she likes it, whatever.) Graph-wise, I thought I should see larger swings as I lifted the big weights and then into rest/recovery.I still think that I goofed my 1 repetition max test by attempting six lifts when I should have attempted a higher set by using only three lifts (instead of wearing myself out faster with six.) The hypertrophy part was characterized high lifting volume with moderately high resistance.
  • Resistance Phase/strength (P1s)—this portion was characterized as reduced lifting volume and increased resistance. There were some definite sore points within this period, although at the end my system seemed to spring back with some better index numbers at the end. I think the percentage lift points would’ve been higher…noted for next time.
  • Resistance Phase/power (P1p)—characteristics include increased lifting speed, reduced resistance, and sprint interval workouts. This was a volatile combination. Most of the period saw lower index points where near December 10, I forced a couple of recovery days less I continued to dig myself into over-training. The need to lift “faster” eventually found me lifting the squat bar enough to “hop” into the air. Again, these workouts were draining, and it reflected in the index plot.
  • Aerobic Endurance Phase (P2)—the graph shows a higher index trend, which I believe reflects the lower measure of time spent on riding near/above the 76% FTP minimum target. There were sprint and muscle endurance intervals intended to complement the endurance riding, most of the time the difficulty was not in completing the intervals. The problem was in accruing time-in-the-zone (TIZ) at the minimum target for the specified duration. Try as I might and even with best effort, the most effective extraction to stay in zone two (above 76% FTP) was only 44% to 51%. In other words, I could ride for three hours, yet only have half the ride time above my target. If I rode for five hours, again roughly half would be credited towards correct TIZ. So, to accomplish four to six hours at zone, I would have to ride for six to eight hours…not a realistic idea. The cause was this: riding outside, I’m subject to traffic, stop light and signs, pedestrians and speed limits on multi-user trails, etc.—constraints to my effort. There’s nothing I can do to omit those factors. On the other hand, I could decide to do that time requirement on the trainer, and I did for most of it. However, about 3 ½ hours was all I could muster on a trainer, any more than that I just could not get my brain around. Note: the 76% figure comes from Morris’ designation of the lower limit for the endurance zone on his scale. I figure he’s got a good reason for making it that way. Overall, I did not gain the volume target for this period, and that’ll likely hurt me later on. Because the phase intensity/impact was less extensive, the graph shows higher index marks. (My reasoning anyway.) I had played with the idea that this phase indicated that some type of “form” had incurred, but then I hadn’t done much riding comparatively for me to truly accept having any “form.” I had also extended this period by two weeks to try to meet requires. Next year, I’ll try to find a longer, uninterrupted stretch of road like a secondary state highway to meet the TIZ requirements.
  • Aerobic Endurance Phase/rest week (P2r)—this is the built-in rest week for the second phase. It has its own training regimen oriented around rest days and a few (but more intense) short interval workouts. This is also the week that I spent out-sick courtesy of the local flu bug, so not really much training to speak of, nor of much quality rest either. Kind of a waste of a week progress-wise. It’s why the graph’s index numbers are swirling around the bottom of the plot, again, dashed lines indicate non-training days.
  • Phase 3 Supermaximum Sustainable Power Intervals (P3)—the first two days of this period were sick/non-training days. Although I did try part of the first workout during the second day. Not bad results, I made the target wattage, but was not able to complete the full workout. I deemed it “OK” after being sick for a week.

In closing, I’ll keep watching the “big picture.” Next year this time, I’ll use the lessons learned after this evolution to make the program better.

Thanks for reading. My next post should show how I was able to integrate the BSXinsight Lactate Meter into the training program…and I’m really looking forward to learning that! See ya.